So, you are using Grafana to show off a bunch of interesting data you have in Log Analytics. You build up a Kusto query (like the one below that shows % CPU utilization averaged per hour).
InsightsMetrics
| where Namespace == "Processor" and Name == "UtilizationPercentage"
| extend Computer = iff(Computer == split(Computer, ".")[0], Computer, split(Computer, ".")[0])
| summarize avg(Val) by Computer, bin(TimeGenerated, 1h)
| project-rename Avg=avg_Val
| project Computer, TimeGenerated, Avg
| where Computer in ($Computers)
| sort by TimeGenerated asc
But when it shows the legend, it looks a little like this…

It’s prepending “Avg “ to the start of each server name. That makes the legend much less readable. So, how do we remove that? Welcome to the wonderful world of Transforms!
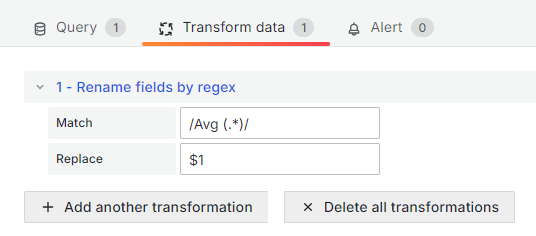
You can create a Transform in Grafana to perform a variety of tasks. In this case, we will be using the “Rename fields by Regex” feature.

The text I am using is:
/Avg (.*)/
$1
And here’s the result!

Summary: Little changes like this can make a dashboard much more readable. So, if you have stuff in your legend that isn’t needed, try out the “Rename fields by Rexeg” feature!

;)


