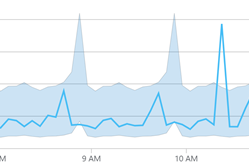
Recently I was working with creating alerts from metrics such as CPU in Azure Monitor. I have spent a lot of time working on Alerts from Log Analytics as a source, but not from metrics. When defining CPU alerts (or any other type of alert) for metrics, you can choose either a static threshold or a dynamic threshold (as shown below).
Figure 1: Dynamic thresholds for metrics
Operator options: Greater or Less than, Greater than, Less than
Aggregation type: Average, Maximum, Minimum, Total, Count
Threshold sensitivity: High, Medium, Low
The alert creation process lets you preview the results of this or any other type of alert. For example, the figure below shows the boundary range for where alerts would and would not generate (an alert would be expected at about 10:30 am in the example below).
Figure 2: Configuring signal logic for a dynamic alert
So far, based on my experiences, this functionality works well. I have only had one alert up to this point on the various systems that are being watched via this CPU alert using dynamic thresholds. But, I will admit, I had my concerns….
<FlashBack Start>
The year is now 2010. System Center Operations Manager (SCOM) is making waves in the monitoring industry and includes some exciting technology called “self-tuning-thresholds.” The idea behind this functionality is that SCOM could monitor a performance counter over time and identify what the normal range for that counter is. These were a challenge to work with as the logic behind the math used was not well explained initially.
Figure 3: Flashback to Self-Tuning Thresholds (STT)’s in SCOM
Did they work? The community consensus was that these alerts were often very noisy, and some metrics were not a good choice for a self-tuning threshold (such as a value that was consistently at 0).
<FlashBack End>
Summary: Dynamic thresholds in Azure’s monitor appear to be an excellent way to identify changes in behavior for various metrics. They do not appear to be too noisy and can be tuned by altering the threshold sensitivity and operator options.
In the next blog post we will disassemble the Azure alert email format.

;)


