Recently I was working with a customer who was interested in developing alert queries similar to those built-in with System Center Operations Manager (SCOM). We started with the development of a low disk space condition. For those not familiar with how SCOM handles alerting for low disk space conditions check out Kevin’s blog post: How Logical Disk free space monitoring works in SCOM – Kevin Holman’s Blog.
The query that I developed uses both % free space and free megabytes to alert when both conditions have reached the appropriate thresholds. This query was designed to work both as a warning alert and a critical alert depending on the values that you provide at the start of the query. For a critical alert I use these values:
let FreeMbMin = 0;
let FreeMbMax = 1000;
let FreePercentMin = 0;
let FreePercentMax = 5;
let Severity = “Critical”;
For a warning alert I use these values:
let FreeMbMin = 1000;
let FreeMbMax = 2000;
let FreePercentMin = 5;
let FreePercentMax = 10;
let Severity = “Warning”;
This approach is fully customizable as you can choose the thresholds for both conditions, or could even add another condition to test for (Critical, Warning, Proactive?)
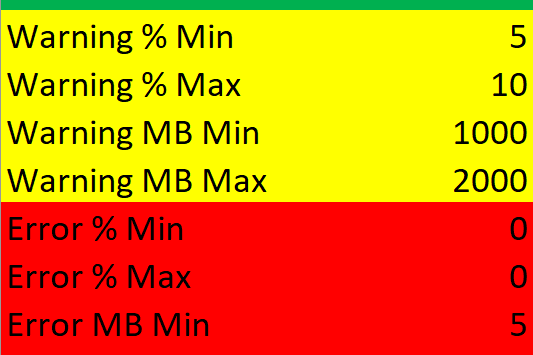
The matrix I am using for free disk space health is shown below:
An example matrix of these conditions is shown below:
The query is available below:
let FreeMbMin = 0;
let FreeMbMax = 1000;
let FreePercentMin = 0;
let FreePercentMax = 5;
let Severity = “Critical”;
let LastCounterPercent = Perf
| where ObjectName == “LogicalDisk”
and CounterName == ‘% Free Space’
and CounterValue >= FreePercentMin
and CounterValue < FreePercentMax
and InstanceName != “_Total”
| summarize TimeGenerated = max(TimeGenerated) by Computer, InstanceName;
let CounterValuePercent = Perf
| where ObjectName == “LogicalDisk”
and CounterName == ‘% Free Space’
and CounterValue >= FreePercentMin
and CounterValue < FreePercentMax
and InstanceName != “_Total”
| summarize by Computer, InstanceName, CounterValue, TimeGenerated, _ResourceId
| extend summaryPercent = strcat(_ResourceId, Severity, ” Low Disk Space “, Computer, ” on disk “, InstanceName, ” value of “, toint(CounterValue), “% free disk space threshold is “,FreePercentMin, ” to “, FreePercentMax);
let LastCounterMb = Perf
| where ObjectName == “LogicalDisk”
and CounterName == ‘Free Megabytes’
and CounterValue >= FreeMbMin
and CounterValue < FreeMbMax
and InstanceName != “_Total” and InstanceName !contains “HarddiskVolume”
| summarize TimeGenerated = max(TimeGenerated) by Computer, InstanceName;
let CounterValueMb = Perf
| where ObjectName == “LogicalDisk”
and CounterName == ‘Free Megabytes’
and CounterValue >= FreeMbMin
and CounterValue < FreeMbMax
and InstanceName != “_Total” and InstanceName !contains “HarddiskVolume”
| summarize by Computer, InstanceName, CounterValue, TimeGenerated, _ResourceId
| extend summaryMb = strcat(_ResourceId, Severity, ” Low Disk Space “, Computer, ” on disk “, InstanceName, ” value of “, toint(CounterValue), ” free Megabytes threhold is “, FreeMbMin, ” to “, FreeMbMax);
let CounterMv = CounterValueMb
| join LastCounterMb on TimeGenerated;
let CounterPercent = CounterValuePercent
| join LastCounterPercent on TimeGenerated;
CounterPercent | join CounterMv on Computer, InstanceName
| project Summary1=summaryMb, Summary2=summaryPercent, Computer, InstanceName, FreePercent = CounterValue, TimeGenerated, FreeMb = CounterValue1
Sample output shown below:
| Summary1 | Summary2 | Computer | InstanceName | FreePercent | TimeGenerated [UTC] | FreeMb |
| Critical Low Disk Space xyz.abc.com on disk C: value of 956 free Megabytes threshold is 0 to 1000 | Critical Low Disk Space xyz.abc.com on disk C: value of 2% free disk space threshold is 0 to 5 | xyz.abc.com | C: | 2.090264 | 7/19/2021, 7:48:06.300 PM | 956 |

;)


