

In this blog, we will provide an overview of KQL and explain the importance of monitoring DHCP logs for security purposes. By doing so, we will highlight how DHCP logs can help identify unauthorized devices, track IP address assignments, and detect potential network intrusions.
In this blog:
- Kusto Query Language (KQL) Overview
- DHCP Logs
- Significance of KQL in Azure Services
- Setting Up Microsoft Sentinel to Collect and Analyze DHCP Logs
- Sample Queries
- Advanced Analysis Techniques Using KQL
- Building Custom Dashboards
- How to collect DHCP information from the command prompt
Kusto Query Language (KQL): An Overview
Kusto Query Language (KQL) is a powerful query language developed by Microsoft for querying and analyzing large volumes of data in Azure Monitor Logs, Azure Sentinel, and various other Azure services. Designed with an intuitive syntax, KQL allows users to efficiently retrieve, filter, and visualize data, making it a crucial tool for security and operational insights.
KQL’s robust syntax offers a wide range of operators and functions, enabling users to construct sophisticated queries. From simple data retrievals to advanced data transformations and aggregations, KQL provides the flexibility needed to handle diverse data analysis tasks.
One of KQL’s standout features is its ability to efficiently process large datasets. This efficiency is critical for real-time security monitoring and operational analytics. KQL also supports integration with visualization tools, allowing users to create insightful dashboards and reports that aid in decision-making.
In conclusion, Kusto Query Language (KQL) is an indispensable tool for querying and analyzing data in Azure services. Its powerful syntax, flexibility, and efficiency make it a cornerstone of data-driven security and operational strategies.
DHCP Logs
The value of DHCP logs in network security and management cannot be overstated. By meticulously capturing the assignment and release of IP addresses within a network, DHCP logs become an essential tool for IT administrators and security professionals.
Identifying Unauthorized Devices
DHCP logs provide a detailed record of every device that attempts to connect to the network. By analyzing these logs, administrators can quickly identify unauthorized devices that may pose a security threat. Each log entry includes information such as the device’s MAC address, the assigned IP address, and the timestamp of the connection. Unfamiliar or suspicious entries can be flagged for further investigation.
Tracking IP Address Assignments
Managing IP address allocations is crucial for maintaining network performance and integrity. DHCP logs offer a chronological history of IP address assignments, allowing administrators to track which device had a specific IP address at any given time. This is particularly useful for troubleshooting network issues, resolving IP conflicts, and ensuring efficient utilization of IP address spaces.
Detecting Potential Network Intrusions
Regularly monitoring DHCP logs can help detect abnormal patterns that may indicate network intrusions or malicious activities. For example, a sudden influx of IP address requests from a single device or a series of failed connection attempts can signal a potential attack. By correlating DHCP log data with other security logs and alerts, security teams can quickly respond to and mitigate threats.
By integrating DHCP log analysis into their security practices, organizations can enhance their ability to detect and respond to unauthorized access, improve network management, and bolster their overall security posture.
Significance of KQL in Azure Services
- Azure Monitor Logs: KQL enables users to perform complex queries on log data collected from various sources within Azure Monitor. This allows for detailed analysis of system performance, identification of anomalies, and debugging of issues.
- Azure Sentinel: In Azure Sentinel, KQL plays a pivotal role in security information and event management (SIEM). Security teams can use KQL to create custom queries that detect threats, analyze security incidents, and monitor network activities.
- Other Azure Services: Beyond Azure Monitor and Sentinel, KQL is also used in other Azure services, such as Azure Data Explorer, to analyze telemetry and log data at scale.
The cost to ingest logs into Microsoft Sentinel can vary based on several factors, including the volume of data ingested and the pricing tier selected. Here are some key points to consider:
- Pricing Model: Microsoft Sentinel uses a simplified pricing model that consolidates the costs of Log Analytics and Sentinel into a single rate. This makes budgeting and cost management more straightforward.
- Free Data Ingestion: Microsoft offers free data ingestion for specific services, which helps manage overall costs. For example, new workspaces can ingest up to 10 GB/day of log data for the first 31 days at no cost.
- Retention Costs: Microsoft provides 90 days of free hot storage for all logs pushed to Sentinel. After that, cold storage is available for up to 12 years at a cost. For instance, with an average monthly ingestion of 1.162 TB, the additional Sentinel retention costs approximately $232.40/month or $2788.80/year.
- Pay-As-You-Go and Commitment Tiers: There are two ways to pay for the Microsoft Sentinel service. With Pay-As-You-Go pricing, you are billed per gigabyte (GB) for the volume of data ingested for security analysis in Microsoft Sentinel and stored in the Azure Monitor Log Analytics workspace.
For a more precise estimate, you can use the Azure Pricing Calculator to enter details about your Log Analytics workspace, including data retention and daily data ingestion volume.
Setting Up Microsoft Sentinel to Collect and Analyze DHCP Logs
Monitoring network activities is crucial for maintaining the security and integrity of your organization’s IT infrastructure. Microsoft Sentinel, a powerful SIEM tool, allows for comprehensive analysis of DHCP logs to detect unauthorized devices and track IP address assignments. Here’s a step-by-step guide to setting up Microsoft Sentinel to collect and analyze DHCP logs.
Step 1: Configure Data Connectors
To begin, you need to set up data connectors to collect DHCP logs in Microsoft Sentinel.
- Access Microsoft Sentinel: Navigate to the Microsoft Sentinel workspace in the Azure portal.
- Data Connectors: Under the Configuration section, select “Data connectors.” For information on Windows event Log Data Sources:
- Select DHCP: Locate and select the DHCP connector from the list of available connectors.
- Configure the Connector: Follow the on-screen instructions to configure the connector, including specifying the log source and any additional settings.
Step 2: Integrate Logs into Sentinel
Once the data connector is configured, the next step is to integrate the DHCP logs into Microsoft Sentinel.
- Create a Log Analytics Workspace: If you don’t already have one, create a new Log Analytics Workspace in Azure.
- Link to Sentinel: Link your Log Analytics Workspace to Microsoft Sentinel.
- Data Collection Rules: Define the data collection rules to specify which DHCP logs should be collected and how they should be processed.
- Validation: Validate that logs are being collected correctly by running a few sample queries.
Step 3: Continuous Monitoring and Analysis
With DHCP logs integrated into Sentinel, you can now set up continuous monitoring and perform analysis.
- Sample Queries: Use KQL to create sample queries for analyzing DHCP logs. For example:
– Identify Unauthorized Devices:
DHCPLogs | where DeviceType == "Unauthorized" | project TimeGenerated, DeviceName, IPAddress, MACAddress – Track IP Address Assignments:
DHCPLogs | where EventID == "DHCPAssignment" | project TimeGenerated, IPAddress, DeviceName, MACAddress - Create Alerts: Set up custom alerts to notify security teams when specific conditions are met, such as the detection of unauthorized devices.
- Dashboards: Design and implement dashboards to visualize DHCP log data, providing real-time insights into network activities.
Step 4: Advanced Analysis and Real-World Applications
To maximize the benefits of monitoring DHCP logs, consider advanced analysis techniques and real-world applications.
- Custom Alerts: Create sophisticated alerts that combine multiple criteria to detect complex security threats.
- Dashboards: Develop comprehensive dashboards that provide a holistic view of network activities, helping to identify patterns and trends.
- Case Studies: Learn from real-world examples where analyzing DHCP logs has helped in detecting and mitigating security incidents.
Setting up Microsoft Sentinel to collect and analyze DHCP logs is a critical step in enhancing your organization’s security posture. By following this guide and leveraging the power of KQL, you can effectively monitor network activities and proactively address potential threats. For more information, refer to additional resources and documentation provided by Microsoft.
Sample Queries
Query to identify unauthorized devices:
DHCPLogs | where DeviceType == "Unauthorized" | project
TimeGenerated, DeviceName, IPAddress, MACAddress This query helps identify any devices that are not authorized to be on the network by filtering the logs for devices marked as unauthorized and projecting relevant details like time, device name, IP, and MAC addresses.
Query to track IP address assignments
DHCPLogs | where EventID == “DHCPAssignment” | project
TimeGenerated, IPAddress, DeviceName, MACAddress
This query allows teams to monitor the assignment of IP addresses to devices by filtering events where IP addresses are assigned and projecting details such as time, IP address, device name, and MAC address.
Advanced Analysis Techniques Using KQL
To take your analysis of DHCP logs to the next level, you can employ advanced techniques using KQL (Kusto Query Language). This section will guide you through creating custom alerts and dashboards in Microsoft Sentinel, optimizing query performance, and avoiding common pitfalls.
Creating Custom Alerts
Creating custom alerts in Sentinel allows you to monitor specific events and take proactive measures when certain conditions are met. Here’s a step-by-step guide:
1. Open Microsoft Sentinel
2. Navigate to the ‘Analytics’ tab
3. Create a new rule
- Click on ‘Create’ and select ‘Scheduled query rule’.
4. Define the rule
- Name your rule and provide a description.
- Select the relevant data source, in this case, DHCP logs.
5. Write the KQL query:
DHCPLogs | where DeviceType == "Unauthorized" | project TimeGenerated, DeviceName, IPAddress, MACAddress 
6. Set alert logic
- Define the alert logic based on query results, such as triggering an alert when unauthorized devices are detected.
7. Configure actions
- Set up actions like sending an email or triggering a playbook.
8. Review and create
- Review the rule settings and create the alert.
Building Custom Dashboards
Custom dashboards in Sentinel help visualize DHCP log data and monitor network activities in real-time. Follow these steps:
1. Go to “Workbooks”
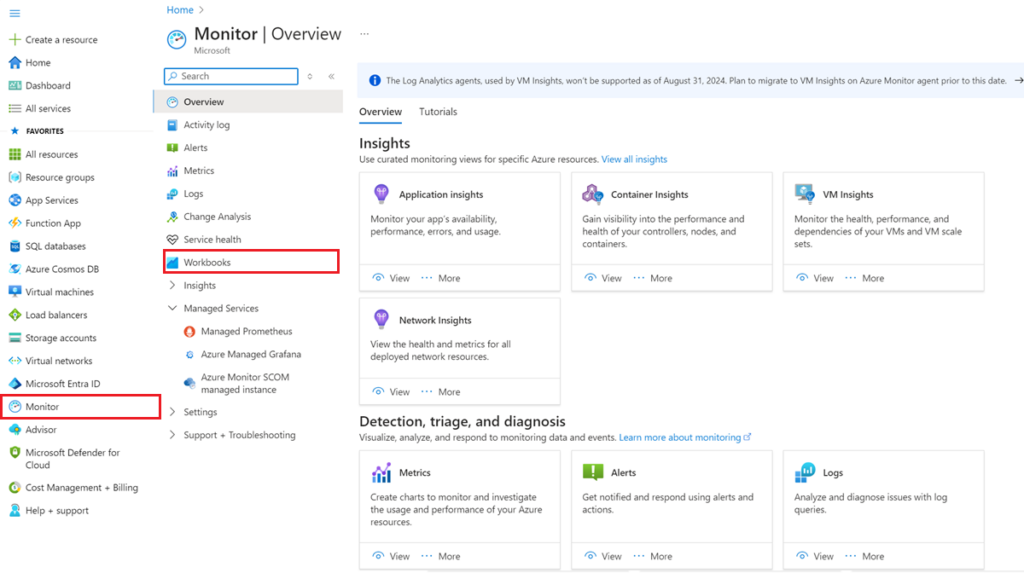
2. Create a new workbook
- Click on ‘+ New’ to start a new workbook.
3. Add visualizations
- Use charts, graphs, and tables to display data.
- Example query for IP address assignments:
DHCPLogs | where EventID == "DHCPAssignment" | project TimeGenerated, IPAddress, DeviceName, MACAddress 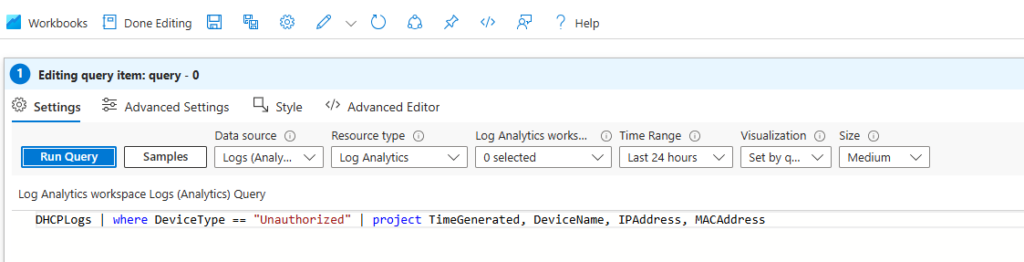
4. Customize the layout
- Arrange the visualizations to create an intuitive and informative dashboard.
5. Save and share
- Save the workbook and share it with your team for collaborative monitoring.
Optimizing Query Performance
Optimizing your queries ensures efficient performance and quick results. Here are some practical tips:
- Use filters wisely: Apply precise filters to narrow down the data scope.
- Minimize projections: Only project necessary fields to reduce query load.
- Leverage summarization: Use aggregation functions like `summarize` to consolidate data.
- Avoid complex joins: Simplify joins or use lookup tables where possible.
Common Pitfalls to Avoid
While working with KQL and Sentinel, be mindful of these common pitfalls:
- Overloading queries: Complex queries can strain resources and slow down performance.
- Ignoring data retention: Monitor data retention policies to ensure critical logs are not deleted.
- Neglecting query limits: Be aware of query limits in terms of results and execution time.
- Skipping index usage: Utilize indexes to speed up query execution.
By following these advanced techniques and tips, you can enhance your analysis of DHCP logs, create effective monitoring solutions, and maintain an optimized and efficient Sentinel environment.
Real-World Examples
Including real-world examples and case studies can make your blog more relatable. For instance, you can describe a scenario where analyzing DHCP logs helped identify a rogue device on the network, leading to the prevention of a potential security breach.
Case Study 1: Identifying Unauthorized Devices
In one instance, a company noticed unusual network activity and decided to analyze their DHCP logs. By using a KQL query to identify unauthorized devices, they discovered several devices that were not part of their authorized inventory. Further investigation revealed that these devices were being used by an external party attempting to gain unauthorized access to the network. The company was able to block these devices and prevent a potential data breach. https://stateofsecurity.com/what-to-look-for-in-a-dhcp-log-security-audit/
Case Study 2: Tracking IP Address Assignments
Another organization faced issues with IP address conflicts, causing network disruptions. By analyzing DHCP logs with KQL, they were able to track IP address assignments and identify the source of the conflicts. They discovered that a misconfigured device was causing the conflicts. After reconfiguring the device, the network issues were resolved, and the organization implemented additional monitoring to prevent future occurrences. https://snowbit.io/guide/siem-logging-components-log-sources-and-best-practices/
Below is the original blog post from 2011. Please reference this if you are using older techologies.
I needed to document DHCP information for a client across their large Enterprise consisting of more than 15 DHCP servers and each with several scopes. I dreaded documenting by hand, so I turned to my usual trick of collecting information by command line.
First I found just the article I need about how to get DHCP information at the command line from the Technet Article “To use DHCP commands interactively at the command prompt“
My first task was identifying all of the DHCP servers in the organization. Now that could have been easily accomplished from the MMC snap-in, but this is about the Command line.
So I used netsh DHCP to accomplish that as well.
- Open Command Prompt.
- Type netsh.
- At the netsh> command prompt, type dhcp.
- At the netsh dhcp> command prompt, type show server. This will give you a list of servers within the current Active Directory domain.
Now depending on what information you need to retrieve you can dive down into each server and then further into each scope to retrieve information. I needed to identify the scopes on each server, where their databases were located, and some general idea of the usage of each scope. And I needed to record this to a text file. So I decided to go into each server and get targeted information from each one.
So I dug up the following commands:
- server \Server01 — Switches which server information is retrieved from. Or, type: server\IPAddress which takes us to the netsh dhcp server> prompt, then I retrieved the information that I wanted using the following commands.
- show scope — Shows basic scope information
- show mibinfo — show scope use information
- show dbproperties — shows Database information
There are several other commands available, use /help to search for the one you need and you can reference this for usage: http://technet.microsoft.com/en-us/library/cc787375.aspx.
You might also look at the dump command. This actually gives you information about the options of each scope when used at the server level. Or you can dig down into each scope using the command: scope ipaddress
Also the show optiondef command will give you the definitions of each scope option. Option 51 is lease time as measured in seconds (that being the most common one you’ll need.
And I discovered that I could run one after the other in a batch file, or in my case by modifying a text file and pasting into the command line.
- Netsh
- dhcp
- server \Server01
- show scope
- show mibinfo
- show dbproperties
- server \Serverdc01
- show scope
- show mibinfo
- show dbproperties
- server \Serverdc02
- show scope
- show mibinfo
- show dbproperties
- server \Serverrdp01
- show scope
- show mibinfo
- show dbproperties
Unfortunately, piping the command out to a text file (>c:output.txt) didn’t work and I didn’t have Powershell on the network (Start-Transcript…..). So I ended up listing two or three servers at a time, while using the select all, cut, and paste commands in the CMD.exe window to paste the text into a notepad file.
All in all, a way quicker and cooler way of collecting DHCP information across the organization, than using the GUI.