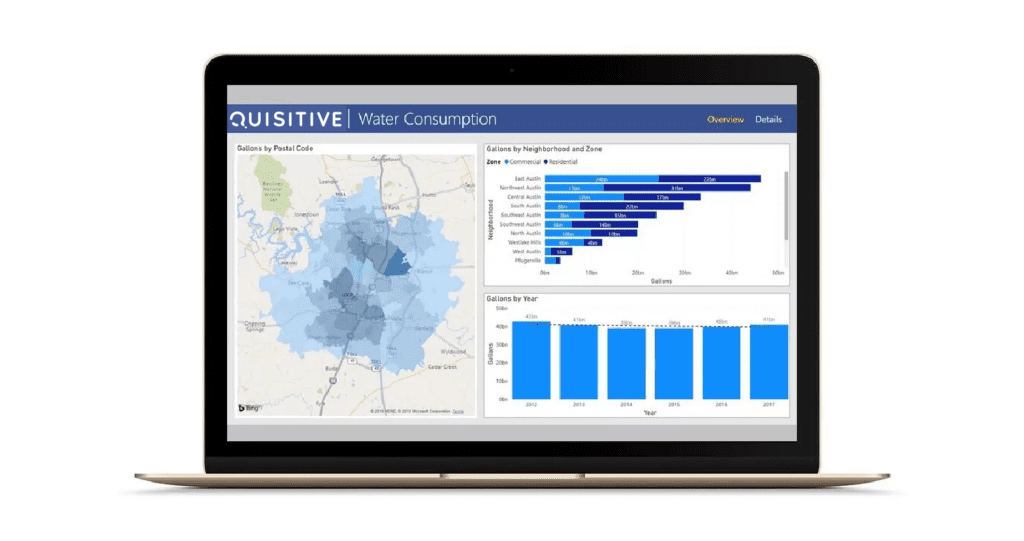
Power BI Demo Gallery
Visualize your data insights and turn it to opportunities with the advanced analytics capabilities of Power BI.
Explore PowerBI

Business intelligence under one roof with Microsoft Power BI.

See Power BI and advanced analytics in action
Quisitive is a leading Microsoft Solutions Partner.